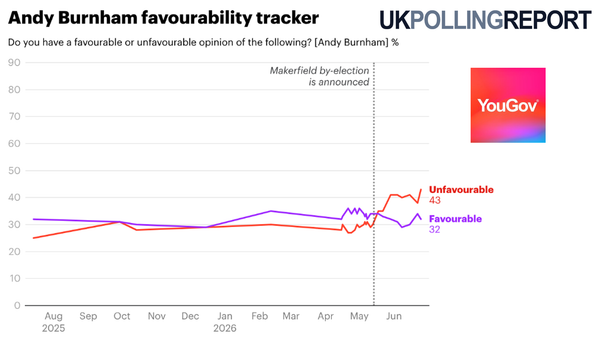
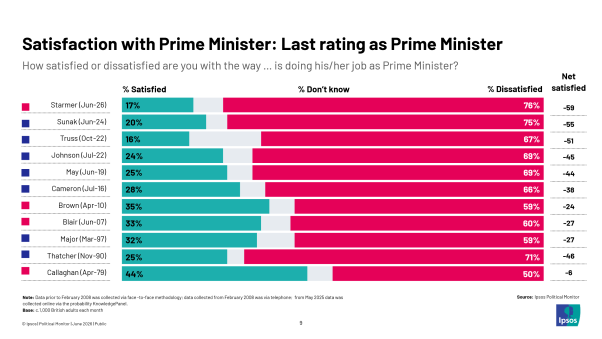
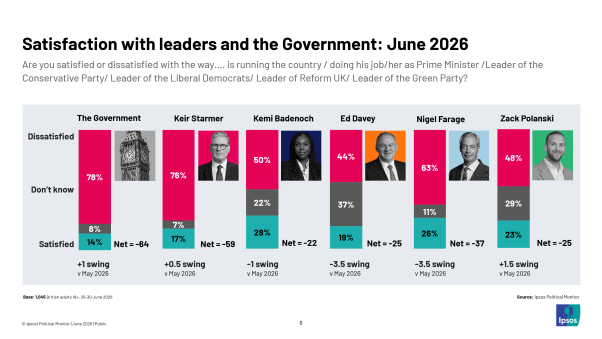
More from the ICM/Guardian poll
The tables for ICM's poll are now available here. Firstly the question on the couples' tax allowance did indeed ask specifically if people would support or oppose a tax break for married couples with children, and found that 65% of people did with only 29% opposed, a far higher proportion of people than other polls suggest support a tax break for married couples per se.
Support amongst married couples with children - the people who might actually benefit from such a tax break - was predictably higher at 78%, but then again 61% of people who were not married or did not have children also supported it. It is very easy to overestimate the extent that people vote with their pocketbooks.
The questions on which social class people think the Conservative and Labour parties stand up revealed an interesting contrast in the way party supporters view their own party. Conservative supporters mostly see the Conservative party as standing up for everybody (57%), with a significant minority saying it stands up for the middle class (29%). Labour supporters however are far more evenly split - 39% see Labour as standing for everybody, but 37% see it as standing for the working classes and 20% see it as standing for the middle classes.
Equally striking is the contrast in how party supporters see the other side. Conservative supporters' view of the Labour party is quite mixed, 34% see it as a party of the working classes, 22% a party for everyone, 18% a party for the middle classes, 12% a party for the upper classes. Labour party supporters view the Conservatives in far starker terms - 55% think they are a party for the upper classes, 22% the middle classes.
What it suggest to me is while class has greatly declined as an important factor in voting, and doesn't seem to be a major factor in Conservative support (they tend to see their party as the party for everyone, and are rather unsure about the opposition) there is still a substantal chunk of the Labour vote that sees their party as the party of the workers, and the Conservatives as the party of the toffs.
Finally, a methodological note - ICM seem to have added what I think is a new factor into how they deal with likelihood to vote. Previously they just filtered by likelihood to vote, taking in only those who said they were 7/10 or more likely to vote. They are still doing that, but are also weighting them so that people who are 10/10 likely carry more weight than those who are 9/10 likely. They are also factoring in whether people voted last time, and weighting those people down by half (so someone who says they are 8/10 likely to vote and voted in 2005 gets a weight of 0.8. Someone who claims they are 9/10 likely to vote this time, but didn't bother in 2005, gets a weight of 0.45